Managing Seasonal Products: OPEN-TO-BUY is Your Best Friend
Jeff Sward
RETHINK Retail Top Retail Expert. RetailWire BrainTrust Panelist. Founding Partner - Merchandising Metrics. Consulting on Strategic Merchandising. How to embrace RISK as a brands' best friend. It's a differentiator.
March 21, 2025
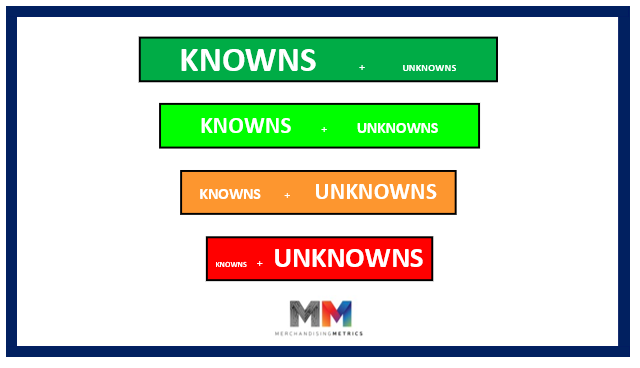
There were times over the years when I think I was probably guilty of under appreciating just how valuable a tool Open-to-Buy really is. It’s more complicated than picking the right stuff or being trend right. Merchants and buyer/planner teams must deliver 5R content.
Right PRODUCT
Right PRICE
Right PLACE
Right TIME
Right QUANTITY
For the purposes of this article, I’m thinking mostly about PLACE and TIME. Or, more simply, seasonality and shelf life. With seasonality and shelf life in mind, I then make the leap to embracing the fact that there are several layers of shelf life involved, at least in apparel. (Apparel is the basis of the thinking here, but the logic will extend to a vast array of products.)
Basics/Essentials/Core Items…Non-seasonal - 12 month shelf life
Seasonal Key Items…Seasonal - 6 month shelf life
Fashion 1…Very Seasonal - 2-4 month shelf life
Fashion 2/Novelty/Event…Highly Seasonal - 1-2 month shelf life
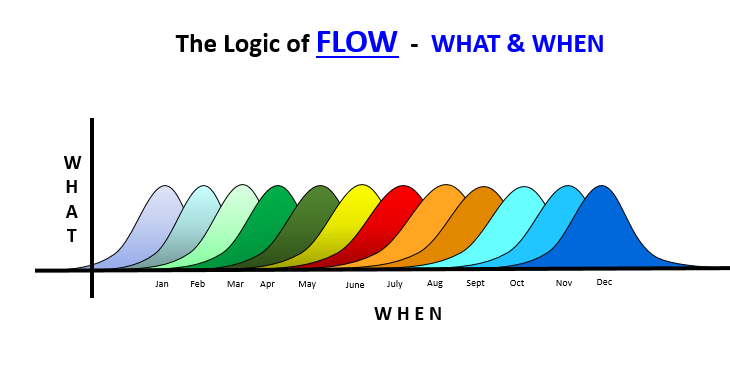
Different products with different fashion and risk attributes with different wearing moments. How does a merchant decide how much of each category to include within the total OTB? The ‘how much of each layer’ question is a little complicated to answer, so let’s start with a simple approach. WHAT & WHEN. What mix of products will maximize my business in each month of the year? What do I want to own and When do I want to own it? The answer to that question is going to be different for each of the 12 months of the years.
The simple graphic above is a suggestion to think in terms of optimizing the inventory content each and every month. Establish the right entry points, the right peak moments, and the right exit points for all layers of seasonal products. Sales expectations will drive inventory allocation in support of those sales expectations (BOM and EOM planned inventory levels). Managing exits on a timely basis creates the space for the entry of the next seasonal offering. SEASONAL CONVERSION is accomplished by first creating the appropriate entry and exit points. Those established inventory benchmarks, along with sales and markdown expectations, form the foundation of the OTB calculations.
And no, it’s not as simple as Spring, Summer, Fall and Winter. It’s not just about seasons and temperature. It’s about naturally occurring calendar events.

The graphic above lays out all the obvious calendar events over the course of the year. Each one has its own sales level opportunity, it’s own entry and exit points. Is your business positioning itself for all appropriate calendar opportunities? Do you have your own very specific merchandising calendar that you are confident captures all seasonal and event opportunities? Does your OTB thinking need a tune up?
On Wednesday, March 26th, I will be participating in a webinar hosted by the teams at ANT USA Inc. and Celerant Technology . Please join us as we discuss integrating Seasonality and Shelf Life into your Open-to-Buy thinking and processes.
#TRE #OTB #Open-to-Buy #InventoryManagement #Planning #Profitability #Flow #risk management #assortmentplanning
Finally, a couple of definitions:
Merchandising:
Merchandising is the strategic integration of the analysis, planning and creative processes. It’s the merging of Data and Design. It’s the balancing and weighting of the RISK levels of Basics, Seasonal Key Items and the different levels of novelty and fashion products. Merchandising understands ‘dosage’…the amount of product from each level of RISK to include in a product portfolio. It balances predictable, low risk products with less predictable, higher risk products to yield both strong profitability and great storytelling. Great story telling embraces the focus and discipline of Important & Obvious. Important & Obvious understands that customers can only digest so much visual input at any given moment. Customers feel faster than they think. They shop and make purchasing decisions with emotions, not logic. Merchandising knows WHAT down-trending ideas to drop and WHEN. It knows WHAT new and fresh offerings to inject and WHEN. It is curating a portfolio of products that creates differentiation and distinction in the eyes of the customer. It involves recognizing and addressing the varying regional and seasonal demands of diverse markets. Product development merchandising anticipates and plans for the visual merchandising and storytelling required during floor set implementation. And it accomplishes all the above within the boundaries established by the Brand Promise.
Open to Buy:
Open to Buy is the strategic allocation of monthly receipts and inventory levels. It involves recognizing the key entry and exit points for various products based on shelf life, seasonal transitions, and significant holidays and promotional events. Managing Open to Buy starts with the sales forecast, followed by establishing the monthly inventory levels necessary to support those sales. Sales projections are essentially demand projections and are inherently fluid. They are supported by varying degrees of data, depending on the nature of the product (Basics, Seasonal Key Items, and different levels of Novelty or Fashion). Consequently, as sales exceed or fall short of the plan, markdowns and receipts will also vary, in proportion to the sales miss, in relation to the plan.
There is a component of the Open to Buy calculation that remains fixed. The monthly planned inventory numbers are established as key benchmarks to ensure that the inventory content is always optimally positioned for future sales and profitability. It is crucial to adhere to the scheduled entry points. Peaks must be achieved both on time and to the right level. Exits must be executed when planned and achieved regardless of any variances in sales versus the plan. Therein lies the role of markdowns and promotions. Future on-order is constantly under review based on changes in the current sales trend relative to expectations. Future markdowns and promotions are also always under review.
Sales and inventory must be managed in monthly increments. Sometimes weekly in certain key categories and calendar windows if exits are to be achieved on a timely basis. The graphic above asks the question, “What & When?”. In every individual month, what’s important? What is the optimal beginning of month inventory? What is the optimal ending of month inventory (next month’s beginning)? Those static points must be managed to, based on sales variances from plan.